spatialHeatmap
An R/Bioconductor package and Shiny app that maps assay values onto anatomical images for spatial context.
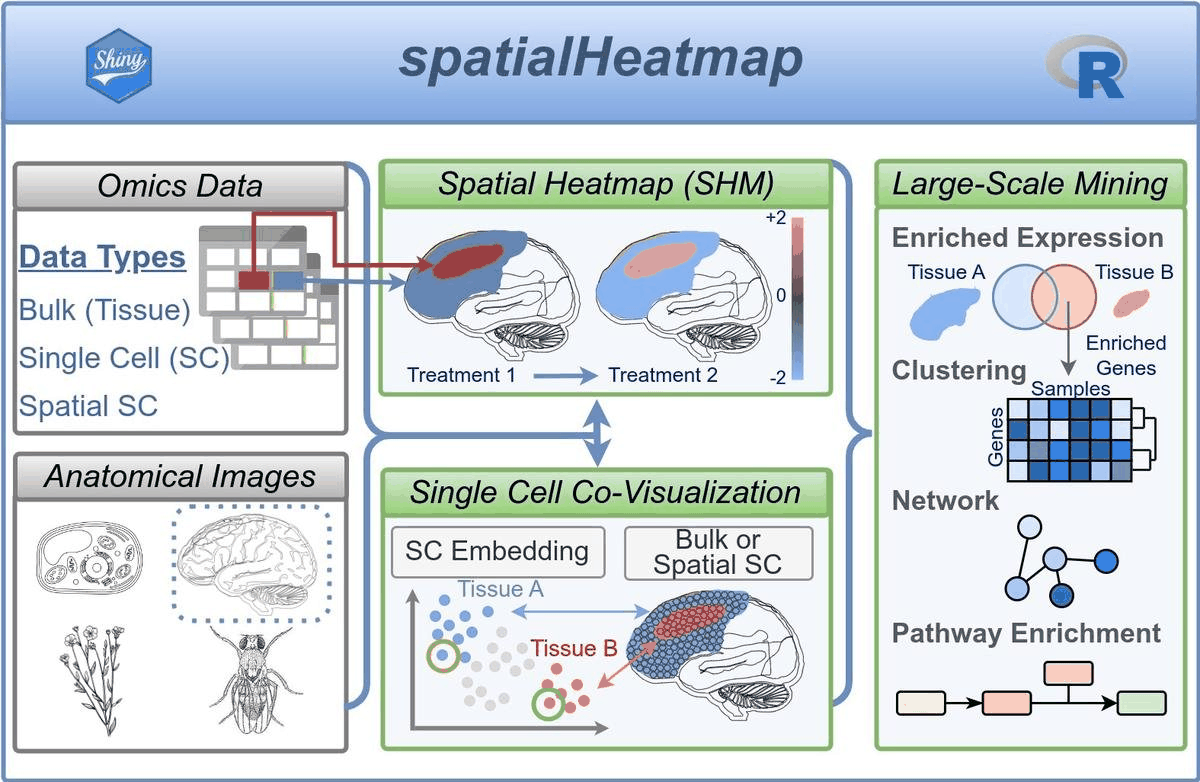
Most omics data gets read off an abstract matrix. spatialHeatmap puts it back where it belongs — on the anatomy. Its signature plot colors the cells, tissues, or organs of an annotated image by measured abundance, like painting numbers onto a map instead of a spreadsheet.
It works from standard annotated SVG templates — public or hand-drawn — paired with Bioconductor data containers, and scales from a single assay to bulk and single-cell omics. A co-visualization mode links spatial heatmaps to UMAP or t-SNE embeddings by matching color, and the toolkit adds spatial enrichment, clustering, and network analysis on top.
The same backend drives both a command-line R API and a Shiny app, so non-programmers and computational users share one workflow — and groups can deploy their own public instances to share spatial data.